PEBBLEWRITER.COM IS LIVE!


*************** PEBBLEWRITER.COM IS LIVE! TO SIGN UP, CLICK HERE ***************


Saturday, October 27, 2012

Forcasting Made Simple(r)

reposted from pebblewriter.com...

For those not incorporating harmonics into their trading strategy, I can only imagine how utterly confusing the market's last drop must have been.  In fact, the entire past six weeks have been a market maker’s dream — constant whipsawing that would have been impossible to anticipate based on earnings, economic data or the advice of the financial media's talking heads.

Seen through the prism of harmonics patterns, the reversal at 1474 was simply a Bat Pattern completion that paid off the 1576 – 666 drop between 2007 and 2009 [see: The World According to Ben].  And, every reversal since then has followed the rules of ordinary harmonic patterns — with an occasional assist from chart patterns (mostly channels.) 


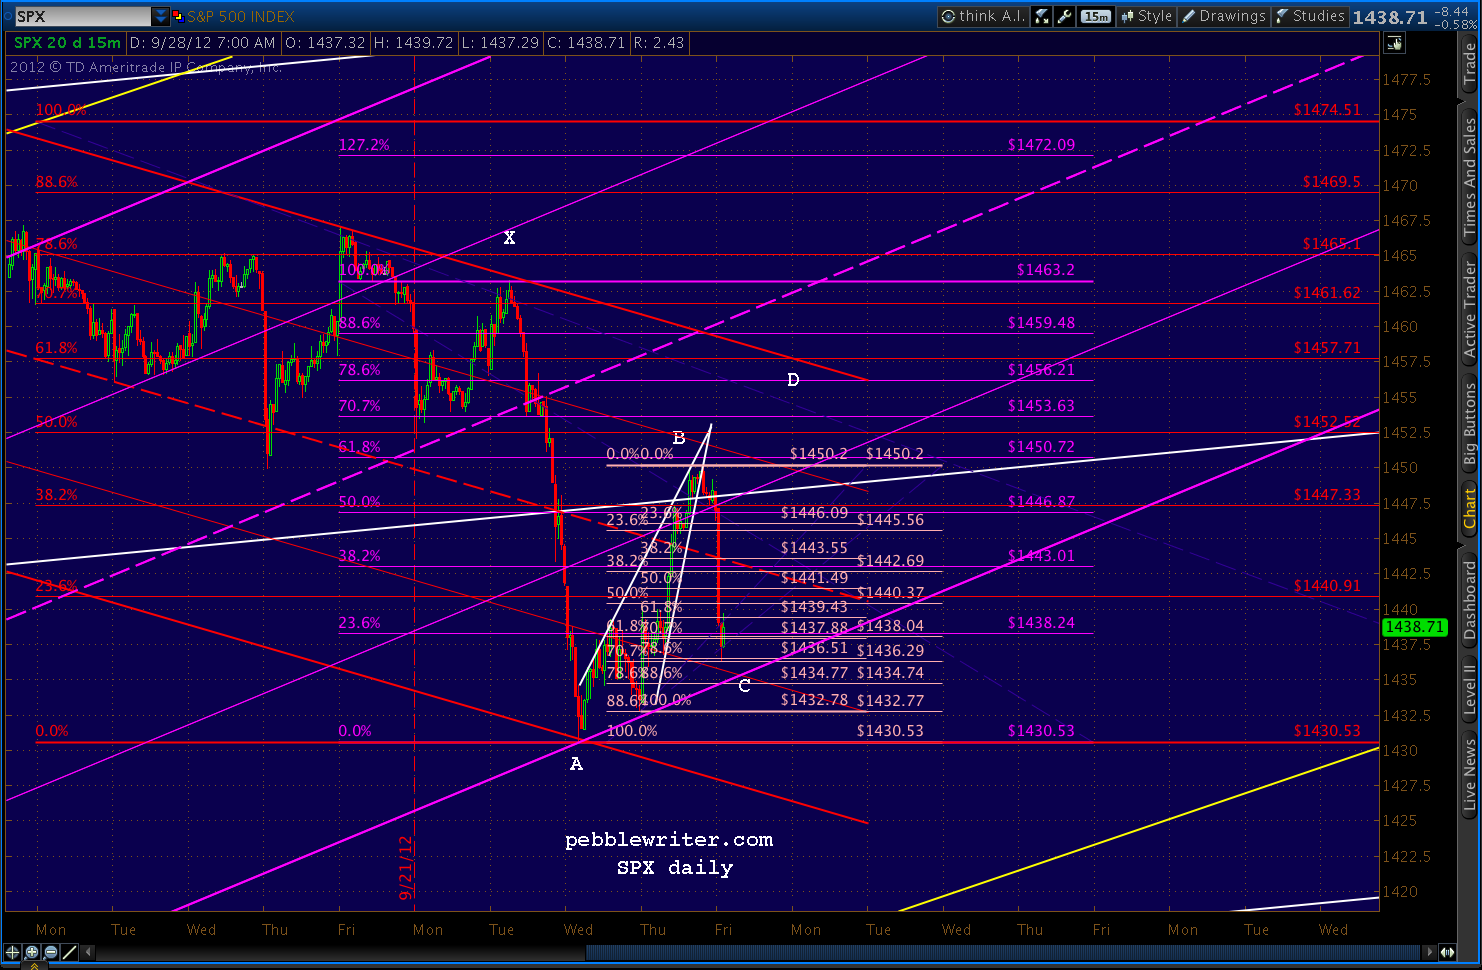
As can be seen from the chart below, the initial drop from 1474 to 1430 was a Bat Pattern retracement and channel line tag.  It, in turn, set up a Bat Pattern (in purple) that signaled a reversal at 1469.50 (came at 1470.96) and established a declining channel (in white.)


The next move down was to the bottom of the new channel and a .618 retracement of the 1396-1474 rally.  It was followed by another Bat Pattern (in green) targeting a reversal at 1465.78 (came at 1464.02.)

The final move down was initially to the white channel bottom, but pushed through to complete a Bat Pattern .886 retracement of the 1396 to 1474 move, as well as a Crab Pattern (1.618 extension) of the 1430 to 1470 move.

By reaching 1405.45, it also solidified the upside case originally discussed back on the 17th [see: Charts I'm Watching - Oct 17, 2012.]
If 1474 was a normal wave 3 or wave 5 high, we would typically be open to a corrective wave of greater than a .618 retracement.  Look what happens if we make it a .786 or .886 retracement.  Suddenly, the yellow 1.618 lines up very nicely with the other 1.618′s up there at 1515-1518.
In other words, a Crab Pattern with 1405 as its base instead of 1425 (the previous low) is consistent with the 1515 Crab Pattern target established by the 1347-1074 drop from July to October 2011, and the 1518 Crab Pattern target set up by the 1422-1266 drop from April to June 2012.


In hindsight, the harmonics and chart patterns have done an outstanding job of showing us the way — even though there were times when the direction suggested made no sense at all.  I'm almost certain that any unsuccessful trades I’ve made in the past six weeks were the result of “knowing better” than the charts and ignoring their signals.

The question now is whether reaching our 1405 target really suggests a move to 1500+, or is it merely setting the stage for a massive bull trap?

For help, I’m turning to an analog I think looks very promising.  We have done very well with these in the past [see: Why Analogs Work.]  The 2011 as 2007/8 analog knocked the cover off the ball last summer.  And, the latest took us from 1422 down to 1266 and back to 1474 in spectacular style — earning us 60%+ returns over those six months.


This new analog is important not just for its capacity to protect investors from losses, but its potential for nice gains for those who don’t mind speculating a bit.

continued at pebblewriter.com...

Tuesday, October 16, 2012

When Wishes Come True

Everyone's heard the expression: "the markets can stay irrational longer than you can stay solvent."  Most of us have lost money on occasion by not observing that truism -- watching markets veering off on a tangent from our brilliantly calculated forecasts.

But what about the Yin to that Yang?  Every once in a while, the market does exactly what I expect -- but in a way that makes me question the results.  This morning's ramp was like that.  

Although we went long last Friday at 1426 with an initial target of 1455.80 on the way higher, the action of the EURUSD and DX this morning had me thinking about fading this rally.  

At times like this, it's best to let the market prove itself.  Find a channel you can live with, and resolve to not even think about bailing unless the market breaks from that channel.  Keep an eye on divergence -- a great early warning tool.  And, as always, use stops wisely.

It's fine to be nervous when there are inconsistencies between markets.  But, those excesses (usually stocks getting ahead of themselves) can yield some of the juiciest returns.  If my thinking was sound in the first place and I follow my own advice, there's no reason to second-guess the results. 


* * * * * * * * * * * * *


reposted from pebblewriter.com...  

note: we entered this morning's session long SPX from Friday [see: CIW Oct 12] after capturing 54 points since our Oct 5 short at 1469 [see: Target 2.]

ORIGINAL POST:  7:45 AM

I'll likely fade this rally.  The prospect of a breakout is there, but there's just as great a chance that it falls back.  Best to follow with tight stops and see where it takes us.

EURUSD has reached our targets (C? and d? below) two days ahead of schedule, but has also reached serious resistance just beyond the .886 of the decline since the 5th and is bumping up against the long-term channel.


The dollar has also reached a potential turning point, the .786 of the rise since the 5th for a potential Gartley -- though the potential exists for a Bat completion down at 79.309.


UPDATE:  9:50 AM

We've reached the top of the former red channel and the white channel midline.  If we break through here, look for at least a back test of either/both.


The currencies are standing back and watching, meaning this rally is nearing a pause at least, and likely needs to gather more strength before advancing any further.  I'm guessing this is just about it for now, and am raising my stops to 1449.


UPDATE:  10:05 AM

Just topped 1450 and the .500 Fib of the 1474 to 1425 drop.  This would be a likely spot for the market to turn.   If it pushes any further, the first .618 is just ahead at 1453.61. 

EURUSD just tagged the original apex of the rising wedge from last week -- still hasn't broken through the last high and is beginning to look quite extended.


DX hasn't quite reached its .886/1.618 channel back-test at 79.309.  However, it did also reach its apex from last week.  It's not only not moving inversely to equities at the moment, it's actually strengthening.


When SPX turns, don't be surprised if we get a back-test all the way to 1443-1445.


UPDATE:  11:05 AM

This is likely the final thrust.  Two .618's just ahead:  the .618 of 1470-1425 drop @ 1453.61 and the .618 of the 1474 to 1425 drop is 1455.80.  The .382 of the 1430-1470 is right in there, too, at 1455.46.   The higher target level of 1455ish is therefore the more likely.

We probably need a pull-back first to gather strength.  SPX is running on fumes as it is.  Yet, there's still no negative divergence to be seen on any time frame.  So, if/when we pull back, the prognosis is for more upside.

Haven't decided yet whether to play the expected pull back from 1455 to 1434ish.  Probably so, as the last time SPX tagged a .618 after a big ramp like this (morning of Oct 1, retraced .618 of 1474-1430 on its way to completing a Bat at 1470) it tumbled a good 18 points.

That .618 tag, by the way, came up .57 short.  With this one, don't be surprised if we also turn before quite reaching it.


UPDATE:  12:10 PM

We just tagged 1455.51, which is good enough for me.  I'm taking profits on the longs we established last Friday at 1426.  I'll try a little short position to play the downside over the next day or two (tight stops, though!)  Forecast for the rest of the week coming up... 


* * * * * * * * * * * * * 

There would have been nothing wrong with taking profits at 1447 on the opening.  We went long last week at 1426, so it would have made for a nice 1.5% addition to a month where we're already up 10%.  But, 2% is better.  And, those half percents here and there really add up.

We won't get all of them, but if we get enough of them over the course of a week/month/year, they can easily add 10-20% annually -- making up for some of the many times when the market doesn't do what I expect.

Join pebblewriter.com now to take advantage of our unique harmonic and chart pattern-based technical analysis that has produced dramatic results:  +75% since inception March 22, 2012 for our unleveraged model portfolio.

Discounted annual memberships are available until the opening bell on Wednesday, October 17.

Click here for more information. 


Thursday, October 11, 2012

The Big Picture: October 11, 2012

reprinted from pebblewriter.com...

The Bat Pattern that completed on Sep 14 [see: The World According to Ben] has played out nicely so far.   Remember, Bat Patterns provide early warning of a reversal at a Fibonacci 88.6% of a previous significant move.  In this case, it was 88.6% of the 2007 -- 2009 crash from 1576 to 666.


Note:  In reality, the pattern paid off twice.  Since SPX reversed at the 61.8% Fib in 2010, it first signaled a Gartley Pattern.  These complete at the 78.6% Fib -- 1381.50 in this case.  SPX came within 11 points of this target in May 2011, providing an excellent opportunity for making money on the ensuing downturn.

Since reversing at 1474, SPX shed 44 points to 1430, then retraced 88.6% of that decline to complete a much smaller Bat Pattern at 1470 on October 5 (charted below in purple.)  Although 44 points is nothing to sneeze at, it doesn't measure up to the 98 points lost the last time a Bat Pattern of this magnitude completed in Feb 2007.

Harmonic patterns frequently nest inside and morph into one another.  An astute trader can either profit from the turns or, at the very least, protect a buy-and-hold portfolio from otherwise unforeseeable market plunges.


There are many ways to utilize Harmonic patterns.  I use them in combination with other chart patterns and technical analysis to enhance the accuracy of forecasts.  A stripped-down version of my current short-term chart shows the role that harmonics, channels and a large rising wedge have played over the past month or so.


The descending red channel did a fabulous job of guiding the downside from Sep 14 to Oct 3.  When it was broken on the 4th, a new channel was established (in white.)  This nearly horizontal channel proved its worth earlier today, signaling us to take profits on a short position established a few days ago at 1455.

All of this action has taken place within the confines of a large rising channel (in yellow above) that's guided prices since the 1266 low on June 4. This yellow channel, in turn, is contained in a larger white channel.  Together, they're playing out a familiar refrain.

As the market rises, it usually accelerates in a series of channels featuring continually steepening slopes (there are several others in addition to the white and yellow.) When the market tops out, it decelerates, breaking these channels one at a time until ready to begin the process anew.


Declines are typically contained in similarly-sloped falling channels -- seen above in red.  The falling red channel in the short-term chart above is barely visible in the upper, right corner of this chart -- providing context for the Bat Pattern reversal from 1474 thus far.

What does it all mean for the future?  The major indicators discussed above (harmonics, chart patterns, etc.) all point to the same conclusion -- a market running out of steam.  In fact, it appears to be in for a nasty downturn in the not too distant future.


Analogs, sometimes called fractals, are simply repeats of past price movements.  The 2011-as-2007 analog provided an opportunity to short the July 2011 crash in advance, accurately predicting the very day the downturn would begin [see: Why Analogs Work.]  Another analog posted this past March [see: Analog Details] accurately predicted the downturn from 1422 and subsequent return to 1474.

Tuesday, I posted a new and promising analog [see: Analog Alert] that shows the top is either already in or will be soon -- perhaps just after the election.  Check daily updates on pebblewriter.com for additional information.

GLTA.

Monday, October 1, 2012

A Good Start

The following was posted earlier today on pebblewriter.com.

We earned 1.25% on a day when the market was up .07%.  A good start to the fourth quarter.  To celebrate our 27% third quarter, we're offering discounted annual memberships to the first 30 takers.  For more information, please click here.


* * * * * * * *

ORIGINAL POST:  9:40 AM

We posted this chart early last Friday morning [see: CIW Sep 28]:
SPX is selling off this morning, but should find support at the purple channel bottom around 1435-1436 and rebound...  If the channel does hold, preferably at the .786 or .886 of the pink pattern, look for the Gartley Pattern we discussed yesterday to complete at 1456.21.  Why?  Yesterday’s high was a perfect Fib .618 retracement of the 1463.20 to 1430.53 drop.


In fact, SPX reversed at 1435.60 minutes later, starting up right at our Point C.  That leaves the Gartley Pattern completion at 1456.2 (Point D) as our next target.  Don't look now, but it's not all that far away.

SPX just hit one of our interim targets at 1450 -- the upper bound of the channel it's been in (and fell out of) for the past several days.  This also represents one of the larger red channel lines and is the Sep 27 top, so we should get a reaction here.

But, we will likely go higher.  Why?


Note that on the 27th, we reversed at the .618 retracement of the 1463 - 1430 drop.  This set up a potential Gartley Pattern at 1456 or Bat Pattern at 1459.

In the midst of that range is the .618 of the larger 1474 to 1430 drop at 1457.71. And, the top of the red channel is currently at, drum roll please, 1457.


In other words, we should get a decent downturn somewhere in the 1456-1459 area -- with 1457 being my favored target. We remain long from 1437, but I plan on taking profits and playing the downturn at that point.  I'll look for a shift in momentum first.

More in a few...


UPDATE:  10:10 AM

That's close enough for me.  Going short here at 1457, with stops at 1460.

We could see one last spurt and tag 1459 or so, but I'd rather bank the 20 points we've earned in the past week and play the reaction.


Note there is another way of looking at the upside since last week -- a relatively flat channel shown below in pink.


Think of it as a rising channel within the falling red channel within the rising purple channel which is within the rising yellow channel.  It's easier to see here...


[Editor's Note:  there followed a study related to our longer-term forecast, available to pebblewriter subscribers.  1457.14 was the actual high for the day, so our decision to sell at 1457 was correct.]


UPDATE:  1:00 PM

The sell-off since this morning's high of 1457 is pausing here at 1448, the next lower red channel line -- also the .500 of the last run-up (smallest purple pattern) and the .500 of both the largest yellow pattern and the red pattern.


It could reverse here, but I think there's more downside ahead.  I'll stay short, but continue to lower my stops.  We've made a nice 9 points since shorting at 1457, and I don't want to be too quick to cover.

I'd like to see it reach the bottom of the pink channel at 1442 or so, the .786 of the latest move up and the midline of the red channel.  The bottom of the purple channel is at 1439.

UPDATE:  1:15 PM

SPX made it past the 1448 level and just reached 1445, the .618 of the rise since 1437 (small, purple pattern.)  There's a much greater chance it will stop here, although there's still downside potential to 1439-1442.


I've drawn a rising purple channel that reflects the upside case (within the pink and red channels.)  If this channel holds, we should get a bounce back to the 1447-1450 area.  This also represents the midline of a potential falling channel (in grey) that does a pretty good job of capturing the downside since 1457 this morning.

If we reverse there, it's on down to 1439-1442.  So, I think the way to play it is to stay short, but lower stops to 1447ish until we see which case plays out.

The dollar suggests the move might be over, as it just hit its midline in the midst of a decline from the top of its channel to the bottom.


In fact, upon further reflection, I'm going to cover the short here at 1445 and go long again, with stops at 1442. I'm probably leaving money on the table, but I trust what the dollar's telling us at the moment.


The bounce could be as small as 1452.  Charts in a few...


UPDATE:  1:55 PM

I think that was the right move.  The 1.618 of the decline from this morning is 1464.77 -- right at our 1465.10 target for completion of the Gartley mentioned at the top of this post.  Recall this represents the .786 of the move down from 1474 to 1430, and would be the bullish interpretation of the .618 tag this morning.

But, that would mean a break out of the red channel that has done a magnificent since 1474 on the 14th -- not a small matter.

More in a few minutes....

UPDATE:  2:05 PM

We have to watch the little purple channel discussed at 1:15 PM like a hawk.  In the past two weeks, breaks of this channel have dealt swift corrections twice -- particularly when they followed a tag of the upper red channel line (15 and 33 points.)


UPDATE:  2:30 PM

I'm raising my stops again, to 1446.50.  The dollar looks like it wants to spike lower  (79.515) towards or shortly after the end of the day.  If so, we should get another spike up in stocks toward the end of the day.


UPDATE:  3:10 PM

Just got stopped out of my long position and going short, probably to 1439-1442 -- the bottom of the pink channel. Will likely take another stab at longs there.  Favorite target 1440.14.

We'll know it's time when the dollar breaks down from its little rising wedge -- seen here on the 5-min chart.  Note it's done hardly anything through this entire sell-off in stocks.


There's a good chance it'll tag the purple channel midline one last time first -- currently around 79.95, and head back down.

UPDATE:  3:37 PM

DX's RSI has broken down from its rising wedge, price should follow within minutes. That's good enough for me.  Closing out shorts here at 1422 and playing the upside on SPX. Initial target is around 1452-1456 tomorrow.


I can envision one last push lower on positive divergence, so I'll set stops fairly loose -- say 1439.  Keeping some powder dry just in case.

* * * * * * * *

TO RECAP...

We shorted at 1457, within .14 of the top, targeting 1439-1442 on the downside (after scoring 20 points on the upside from last week.)  We rode SPX down to 1445, at which point we went long with stops at 1442, later raised to 1446.50.

I should have stayed with my original target, because we got stopped out at 1446.50 and went short again,  again with our original target of 1439-1442.

The low for the day was, in fact, 1440.98.  We covered our short at 1442 and went long into the close, with the understanding that it might dip a little lower in the morning.

All told, we made 18 points (+1.25%) on a day when the market was up 4 points (+0.07%) from Friday's close.  It's a good start.

That's 1.25% on top of last week's 2.44% and September's 11.93%, the third quarter's 27.6%, and the 66.5% since inception a little over six months ago [details here.]  It won't happen like that every day (if only), but we get more than our share.

Making money in both up and down markets requires anticipating and recognizing likely reversal points and taking appropriate action.  Our unique blend of chart patterns, harmonic patterns and technical analysis -- along with a dollop of economic analysis -- might be worth a try.

We have two full quarters under our belt since going pro last March after almost a year of Blogger posts (here!)   My goal was to bring a higher level of professionalism to the process.  So far, so good.

* * * * * * * *

In celebration of another great quarter, we're offering 30 annual memberships to the new pebblewriter.com at a discount to the regular price.  For more details, please click HERE.


The Membership Sale is Live

pebblewriter.com just wrapped the 3rd quarter at the top of its class.  Investors who bought SPX at called bottoms and sold at called tops would have earned over 27% (66.57% since inception last March.)  For details, click here.


Annual membership rates are going up by $100 on October 3.  But, the next 30 annual members who sign up by midnight, October 2 will score a membership for only $665.70 ($10 for every percentage point since inception.)

That’s an $800 membership for only $665.70 — about what you’d pay in 12b-1 fees on a $10,000 mutual fund, a few months of iPhone use, or a 15-gallon drum of Jet-Lube food-grade grease.

While pebblewriter.com obviously might not be as entertaining as a drum of grease, it should be more educational.  And, with all due respect to the guys in Cupertino, our directions have been a lot better.

For $1.82/day, you'll get access to the entire site: long-term and short-term forecasts, trading ideas, rants on politics and the economy, everything.  But, most of all, you'll learn.  No black boxes here.  I  explain why I see things the way I do; so, by the time I'm cruising the halls of the End of the Line Rest Home in my shiny new scooter, you'll be a pro.

Last time we did this, the discount memberships disappeared in just a few days.  Back then, we were up only 37%.  So, tempus fugit.  Enter the coupon code "QUARTER3" when you sign up.  Thanks muchly.


p.s.   If you’re already a member, you may tack it on to your existing membership.   But, remember that pebblewriter.com is just me.  There is no apprentice or back up plan, so if I'm hit by a bus or come unhinged, we're both out of luck.

p.p.s.  pebblewriter.com members received this same notice late last night, so some memberships are already gone.